Took pre-foreclosure leads from county notice to booked seller meeting in one pipeline
A CRM for pre-foreclosure acquisition teams: county-level lead mapping, then a pipeline from notice filed to booked seller meeting.
Figures from staging environment
The problem
Pre-foreclosure acquisition is a race that starts when a notice is filed at the county. Every team in the market is reading the same public record, and the one that reaches the owner first with a credible offer usually gets the conversation. Between the filing and that first call sits a chain of manual work: pulling the new notices, looking up each property, checking the equity position, finding a way to contact the owner, then keeping track of who has been called, who answered and who agreed to meet.
Most teams run that chain across a county website, a spreadsheet and a phone. The spreadsheet is the CRM, and it knows nothing about geography, stage or which notices arrived this morning.
What it cost
Time, mostly, and time is the whole game. A notice that takes a day to reach a spreadsheet and another day to reach a caller is a notice a competitor has already acted on. Properties fall through the cracks when the sheet has no stage column that anyone trusts, and the team cannot answer the simplest management question, how much equity is sitting in the pipeline right now, without somebody adding it up by hand.
What we built
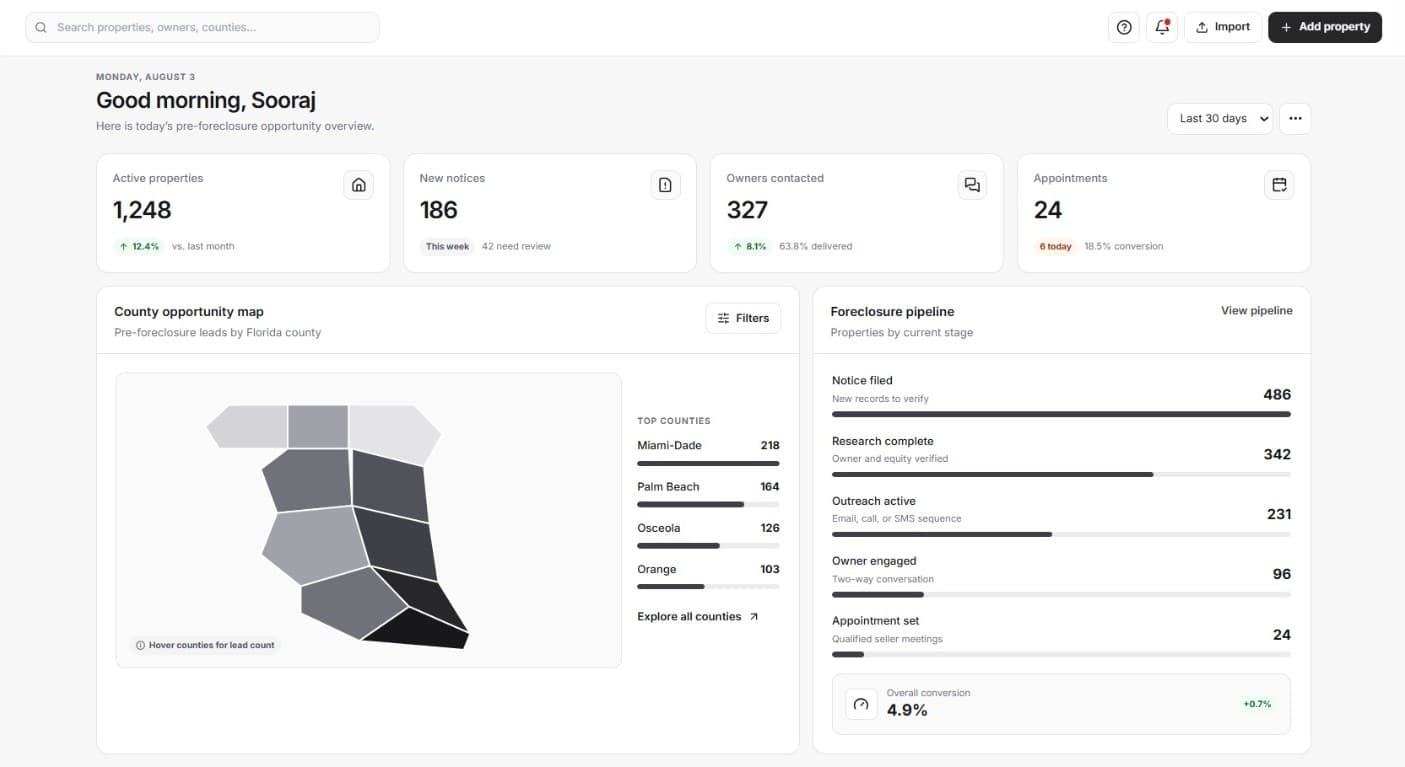
Forefront, a CRM built for this one workflow. New notices land in the system as they are filed and are plotted on a county-level opportunity map, so the team sees where this week's leads are before it opens a single record. From there, each property moves through a pipeline with five stages, from new notice through research and outreach to engaged and a booked seller meeting.
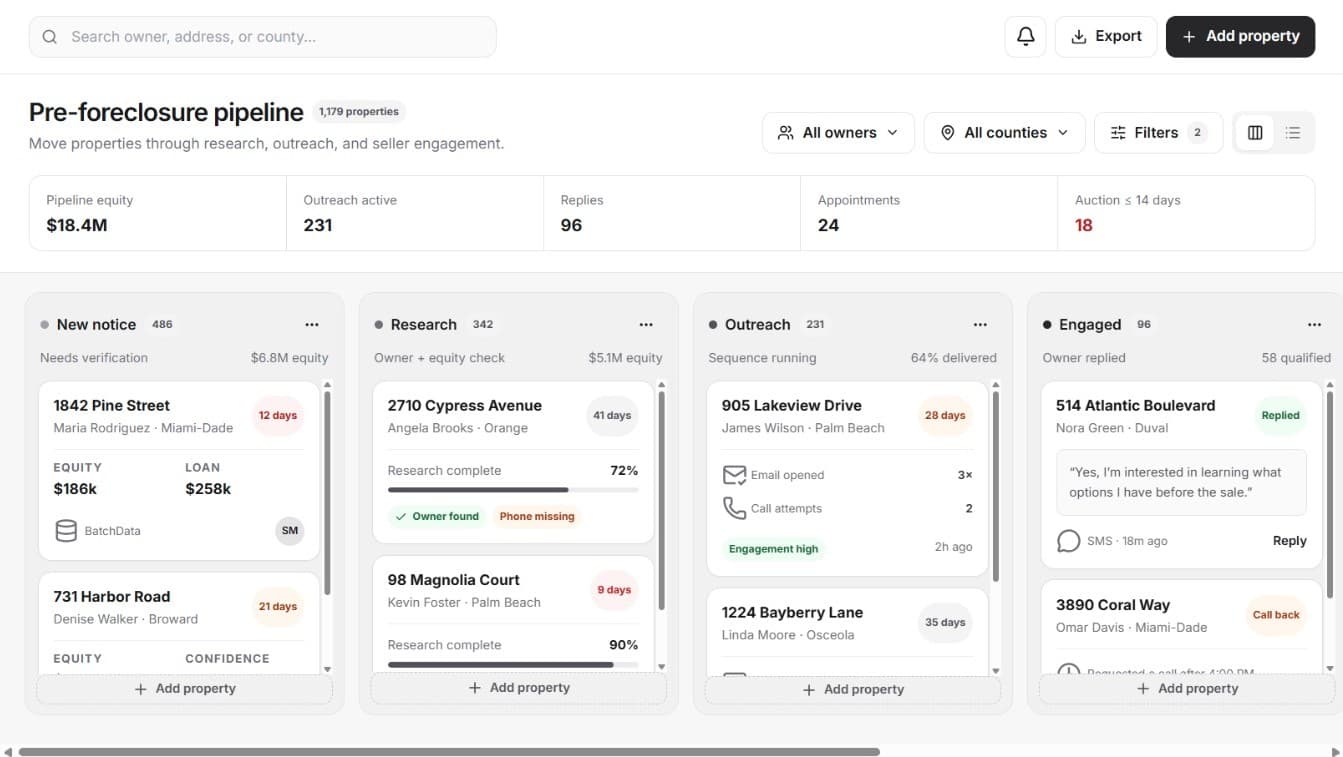
The dashboard carries the counts that matter for running the desk: active properties, the pipeline by stage and total pipeline equity. The board view shows every property as a card in its stage column, so a glance tells the team what is waiting on research, what is mid-outreach and what has turned into a meeting.
Each property card carries the address, the stage it is in and the details the caller needs before picking up the phone, so the record and the conversation are the same screen. The opportunity map colours counties by how many open notices they hold, which is how the team decides where to spend the morning. The pipeline view on the dashboard lists each stage with its count, so the numbers in the board and the numbers in the summary always agree, because they are the same numbers. Nothing is exported to a spreadsheet, because nothing needs to be.
What changed
The pipeline currently tracks 1,248 properties, each one with a stage the whole team can see. Research, outreach and follow-up happen in one place instead of three, and the question of which notices are still untouched has a screen rather than an argument.
The figures on this page come from the staging environment, not from a client's live book.
Stack
- Next.js
- TypeScript
- PostgreSQL
- County records ingest
- Map tiles